
Submarining Evaluation Tool
The Submarining Evaluation Tool is a GUI-based pre- and postprocessing package for objective submarining assessment in occupant simulations. It currently supports the indicator “Nearest Node Dynamic” (NND), which uses the coordinates of the left and right ASIS nodes together with all lap-belt nodes.
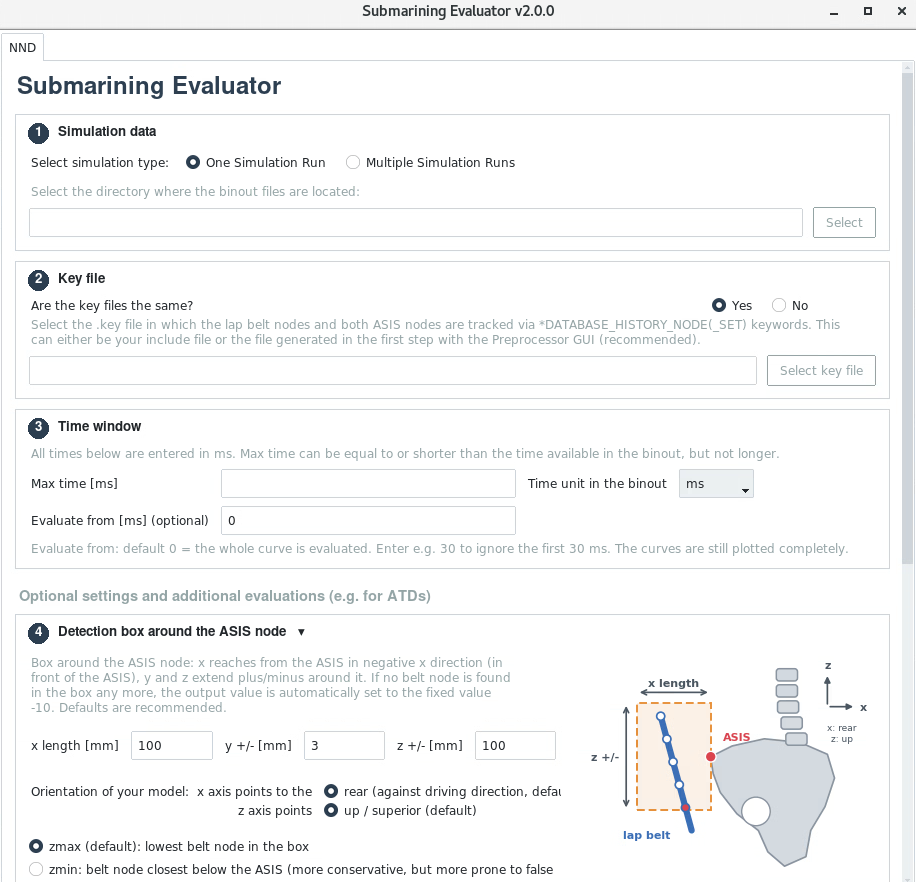
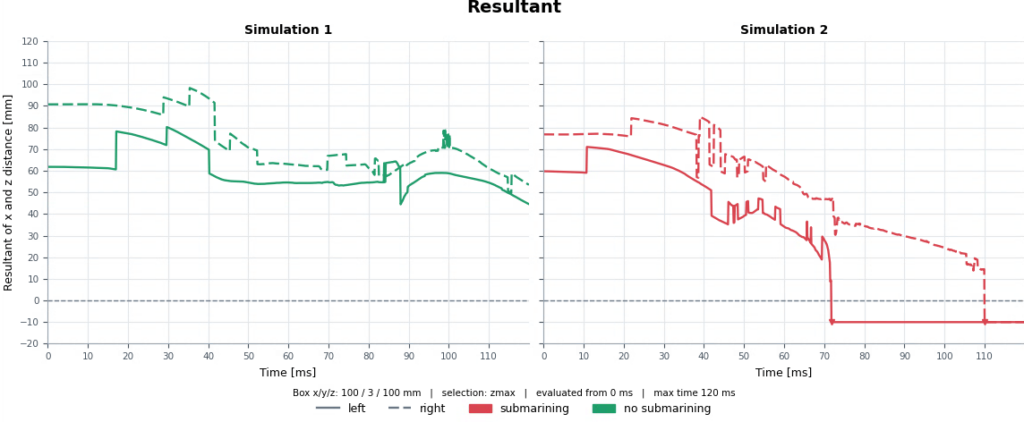
The indicator is evaluated in three steps for each time step and for both body sides. First, a small detection box is spanned around the ASIS (x 100 mm in front of the ASIS, y ±3 mm, z ±100 mm). Second, from the lap-belt nodes inside this box, the node located lowest relative to the ASIS is selected. Third, the distance between the ASIS and this node is calculated, as resultant of the distance in x and in z. If no belt node is left in the box, submarining is indicated by the fixed value -10. Repeating this over time yields the distance histories used for submarining assessment (further details in the IRCOBI paper by Rees et al., https://www.ircobi.org/wordpress/downloads/irc25/pdf-files/2547.pdf).
The tool allows users to generate the required input key-file, evaluate single or multiple simulation runs from binout data, and export plots (super plots of the resultant, Δx and Δz, scatter plots) and a detailed Excel table. Results can be inspected directly in the GUI.
Scripts and Documentation
| Operating system |
Version
|
Last upload
|
Remarks
|
|
| Evaluation Tool | Linux and Windows | V02 | October 2026 |
provided by Marius Rees (BMW) (contact: Marius.Rees@bmw.de) |
| Documentation |
The provided .zip package contains:
- a preprocessing executable for generating the required evaluation key-file,
- a postprocessing executable for evaluating simulation results,
- Windows and Linux versions of both tools,
- example simulation data with two test runs,
- an example pre-processing key-file,
- a readme document (pdf).
The Linux and Windows versions of both GUIs are packaged as standalone executables and do not require a separate Python installation.
Recommended platform: Linux (faster startup and generally better runtime performance, tested on RHEL 8); the Windows version may start significantly slower in some environments (up to 2-3 minutes before the GUI opens).
New in version 2.0:
- Detection box instead of nearest nodes: The belt node is now selected inside a box around the ASIS (x 100 mm in front, y ±3 mm, z ±100 mm). Version 1.x preselected the 14 laterally nearest nodes, which depended on the belt meshing.
- Resultant distance: The result is the remaining distance R in the sagittal (x–z) plane, in addition to Δx and Δz. The x-distance alone can be small although the belt is far below the ASIS. If no belt node is left in the box, submarining is indicated by the fixed value -10.
- Consistent node selection: The lowest belt node (largest signed Δz) is selected. Version 1.x used the absolute value of Δz, which did not match the documentation.
- Optional notch tolerance (especially for ATDs like THOR): belt nodes slightly posterior to the ASIS but at or below it can be counted as well, so that a belt resting in a notch below the ASIS is not reported as submarining too early. Additional plots are saved in a separate subfolder.
- More outputs: Onset of submarining, minimum, slope and values at fixed times, as plots, Excel and CSV files (also with node details for generating own plots).
- Handling: Selectable axis orientation of the model, time unit ms/s, optional evaluation window, results opened directly in the GUI.
- Documentation rewritten to match the implementation; example data updated.